


A variety of tools exist that can be used to troubleshoot different Zabbix components. In this article I will demonstrate how Wireshark can be used to rule out network connectivity issues as the root cause of data collection problems.
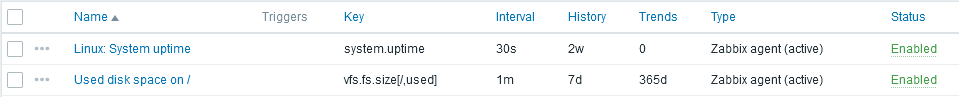
A user has a Zabbix agent that collects the used disk space information on a host. The item interval is one minute:
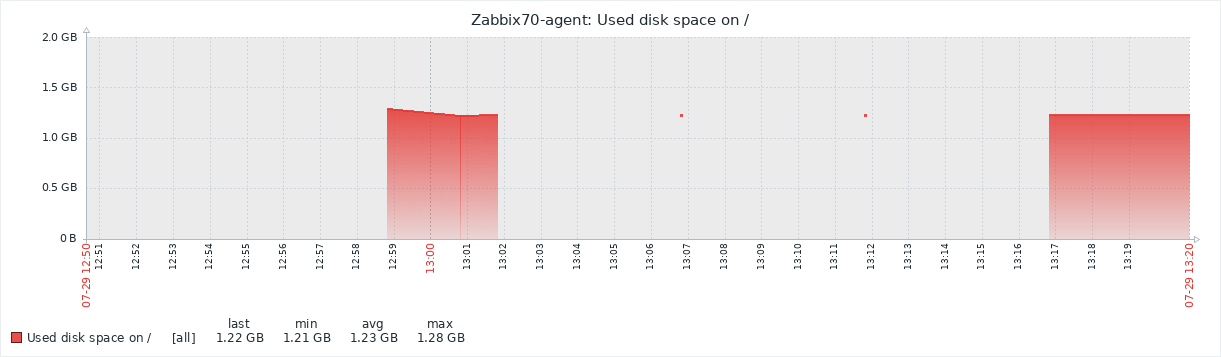
However, the user complains that Zabbix fails to collect the data appropriately, as the graph has empty areas with occasional dots:
In Zabbix implementations with very high NVPS (new values per second) this may indicate some kind of performance problem where not all data is collected or saved to the database properly. However, that does not seem likely in this particular setup as there are only a couple of hosts and items configured and the NVPS value is under 2.
One question to ask whenever data is missing from Zabbix is: Did the data even arrive to the Zabbix server? If all the data never arrived, it is quite natural that there won’t be full data in the graphs or in the database.
As a networking professional one of the tools I always have at hand is Wireshark, the world-famous protocol analyzer (that just had its 25th anniversary!). Starting from Wireshark version 4.1.0, which is the current development release for the upcoming 4.2.0 stable release, it has built-in support for Zabbix protocol. This means that if you have a network capture of Zabbix agent or proxy traffic, you can analyze the Zabbix traffic contents using Wireshark. Previously this was possible also using manually-installed Lua-based scripts, but I was able to write the same functionality in C language and it was quickly accepted in the official Wireshark codebase as well.
Starting from Zabbix version 4.0, all of the traffic between Zabbix server and Zabbix proxies as well as Zabbix agent 2 traffic is compressed to save bandwidth and improve performance. The Zabbix protocol dissector in Wireshark is able to automatically decompress any compressed Zabbix traffic so that application-level analysis is possible. TLS-encrypted Zabbix protocol traffic is also supported if the session keys are available. I’ll write another post about that later.
In this example case I will use Wireshark to confirm that the agent really collects the disk space usage data and sends it to the server.
Note: Zabbix components (server, proxies, agents) are well-known for their stable network communications. They don’t just pretend to send data, so if they really have problems communicating, they should log those events in their own log files. The components also just do whatever they are configured to do, so usually the roots of any item-collecting problems are found by just checking the Zabbix logs and configurations. In this post I still want to highlight one network-centric way to troubleshoot Zabbix-related issues.
I’ll start by capturing the agent traffic on the server, as the agent is communicating directly with the server, not via a Zabbix proxy. On the Zabbix server I will use sudo tcpdump -v port 10051 -w zabbix-traffic.pcap command to start the capture and see its progress.
I will then restart the Zabbix agent using sudo systemctl restart zabbix-agent2 command (on the agent host, this is a Linux host with Zabbix agent 2).
After capturing traffic for a few minutes I’ll stop the capture with Ctrl-C on the server:
markku@zabbix-server:~$ sudo tcpdump -v port 10051 -w zabbix-traffic.pcap
tcpdump: listening on ens192, link-type EN10MB (Ethernet), snapshot length 262144 bytes
^C958 packets captured
958 packets received by filter
0 packets dropped by kernel
markku@zabbix-server:~$
If you want to test the following steps yourself, you can download the capture file here:
- zabbix-traffic.pcap (github.com)
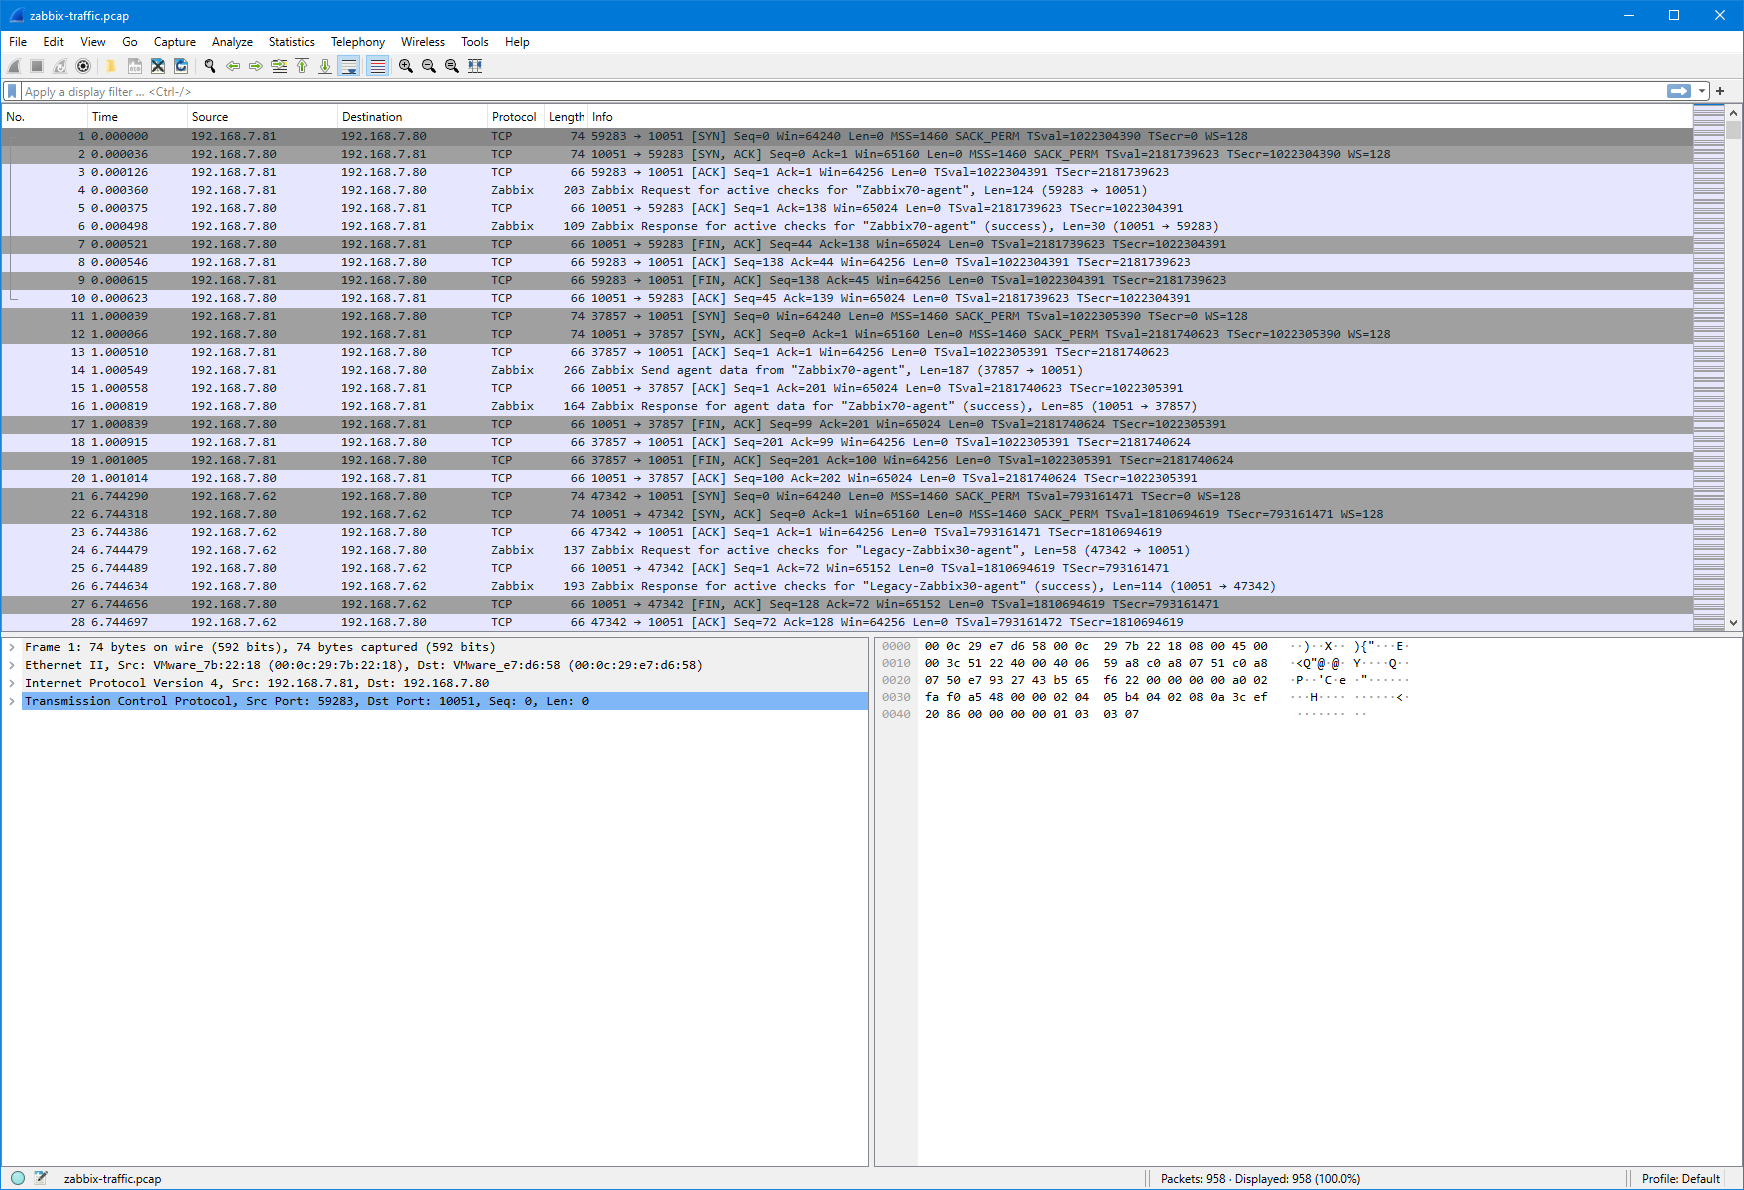
After copying the capture file to my workstation I can open it in Wireshark:
This is still the default Wireshark profile, but I’ll right-click the Profile: Default text in the bottom right corner, select New, and create a new profile called “Zabbix” to continue with some adjustments. (For more information about configuring Wireshark to fit your taste, see my earlier post on my personal blog about customizing Wireshark settings.)
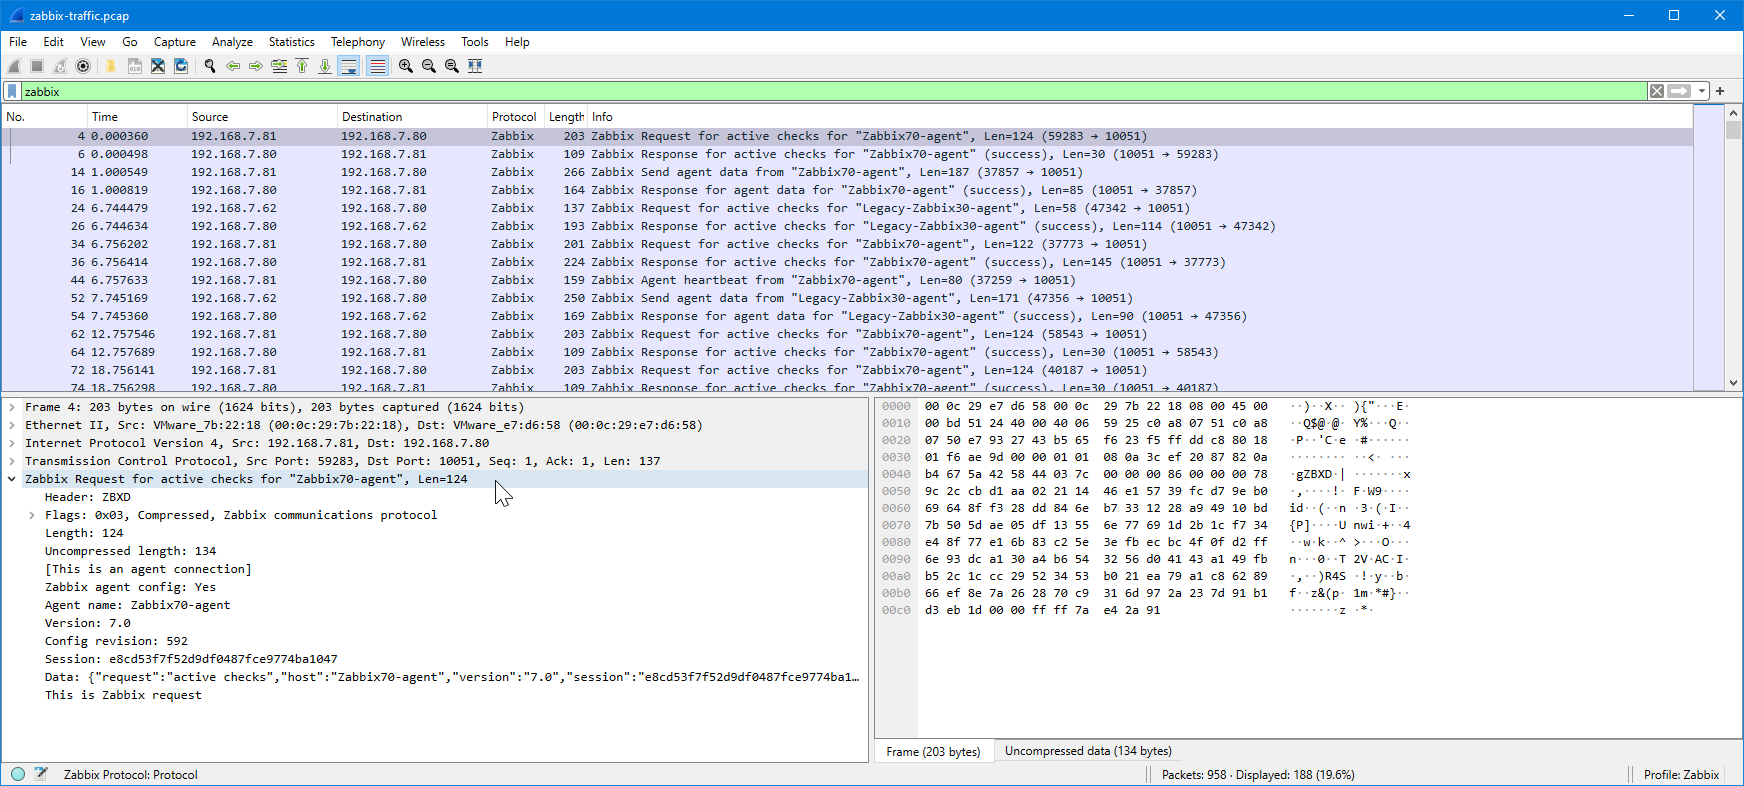
In the display filter field I’ll first type “zabbix” and press Enter.
Note: If your Wireshark does not recognize the “zabbix” display filter, check that you are running Wireshark version 4.1.0 or newer to support Zabbix protocol dissection, as mentioned earlier in this post.
I’ll expand the Zabbix tree in the lower half of the screen to see the Zabbix-specific fields:
I’ll drag the “Agent name: Zabbix70-agent” field to the column headings to add it as a column:
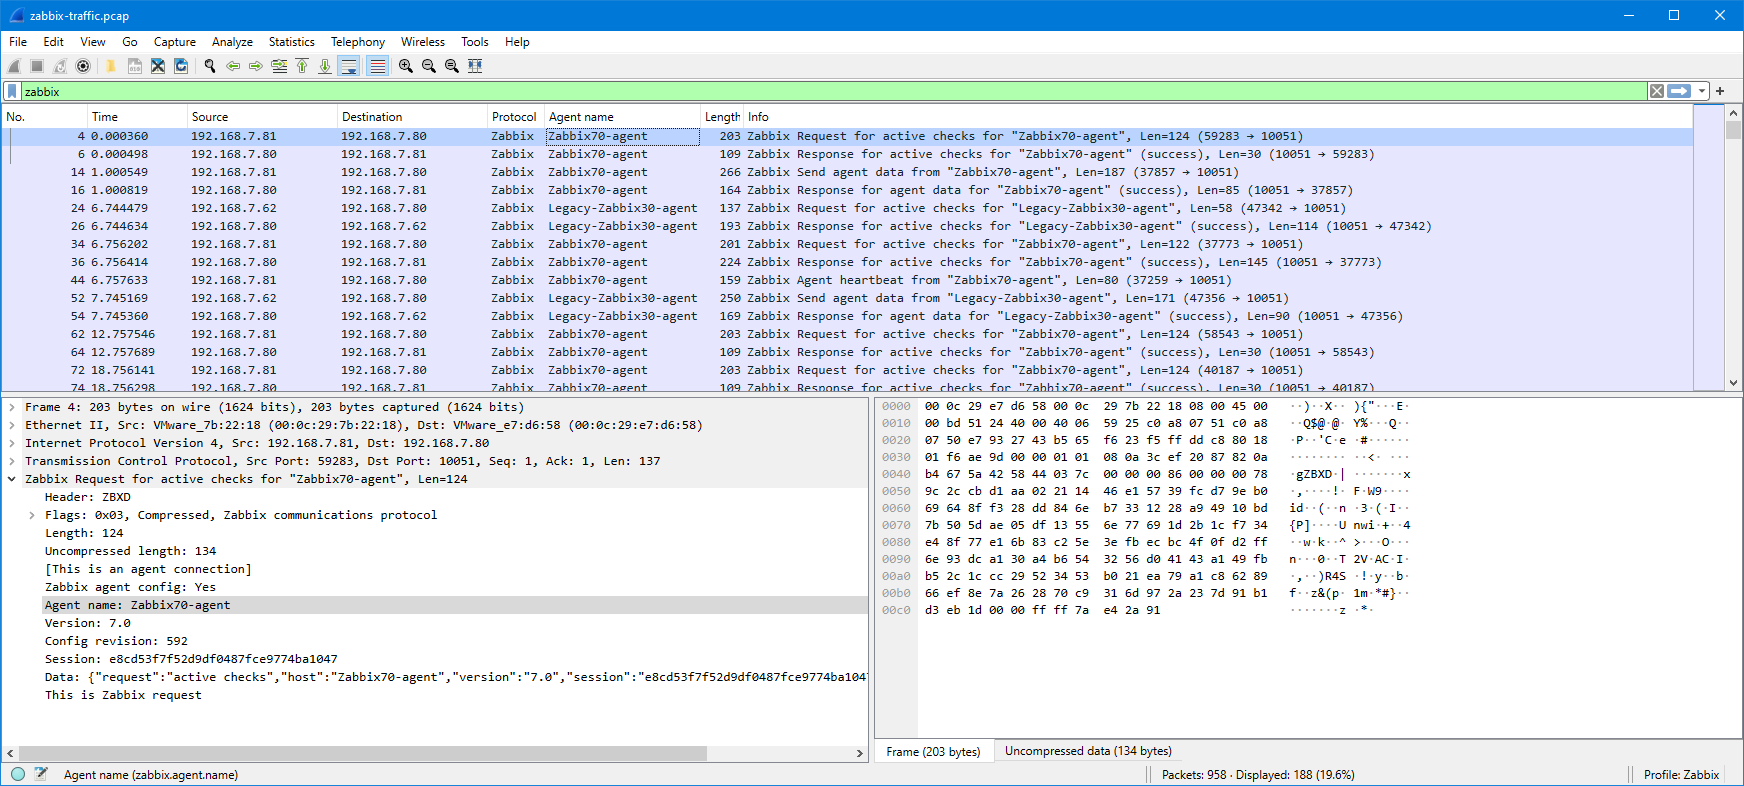
Now I have the agent name conveniently visible in the packet list. The same can be done for any other field as needed. Instead of dragging and dropping the fields, you can also right-click any of the fields and select Apply as column.
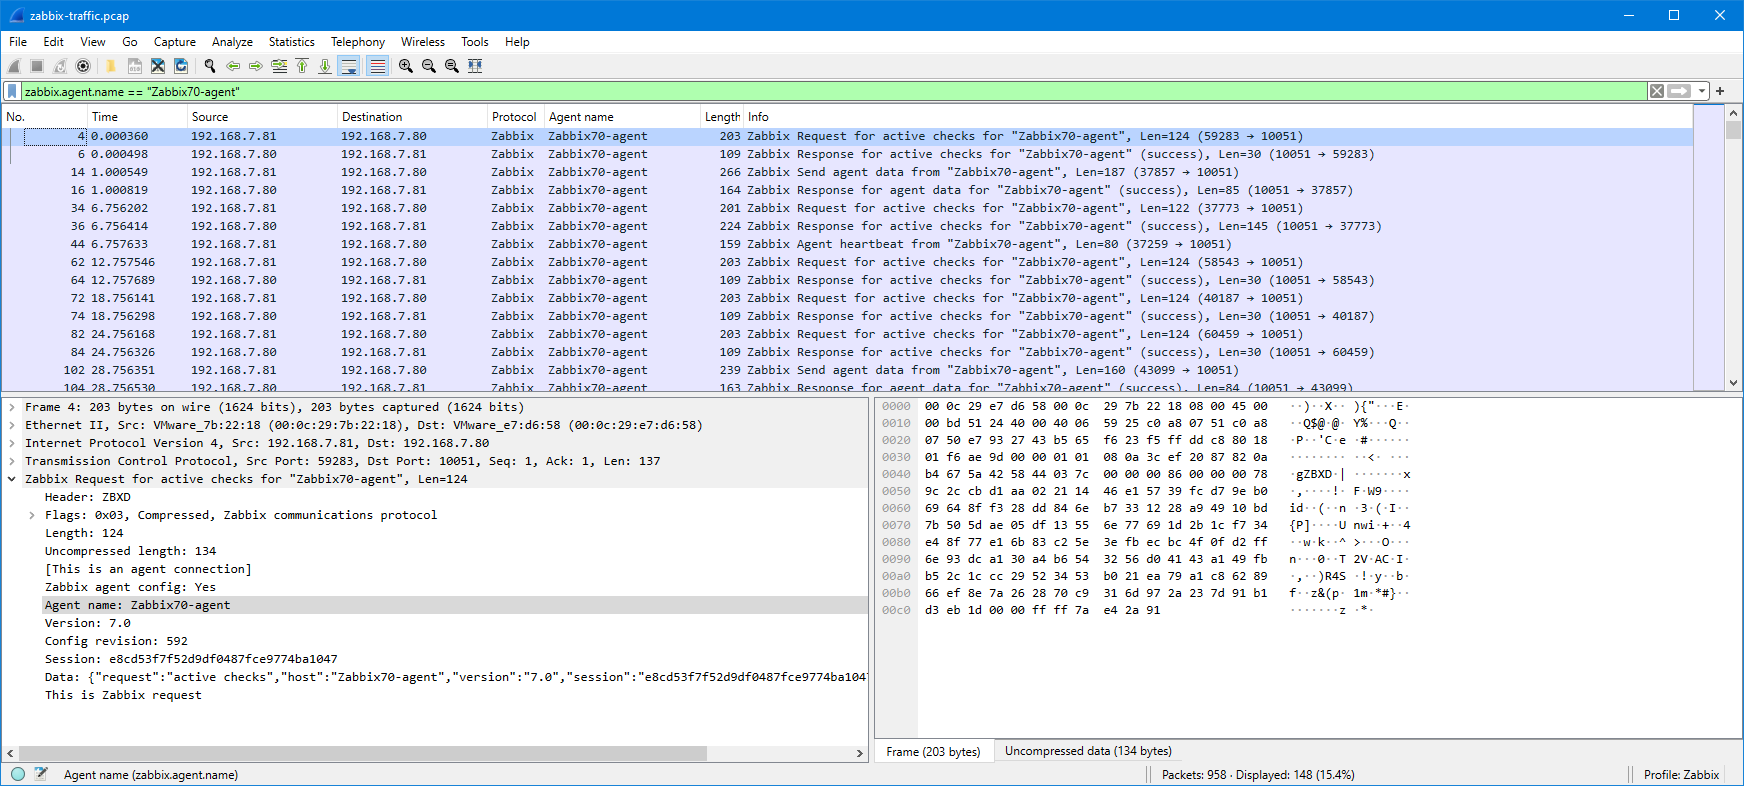
I will now filter the packet list based on the agent name, and since the problem agent “Zabbix70-agent” is already visible in the list, I can just drag the agent name into the display filter as “zabbix.agent.name == "Zabbix70-agent"“:
Now, the original issue is that I want to ensure that the agent really sends the monitored data to Zabbix server, so let’s check one of the “Zabbix Send agent data” packets:
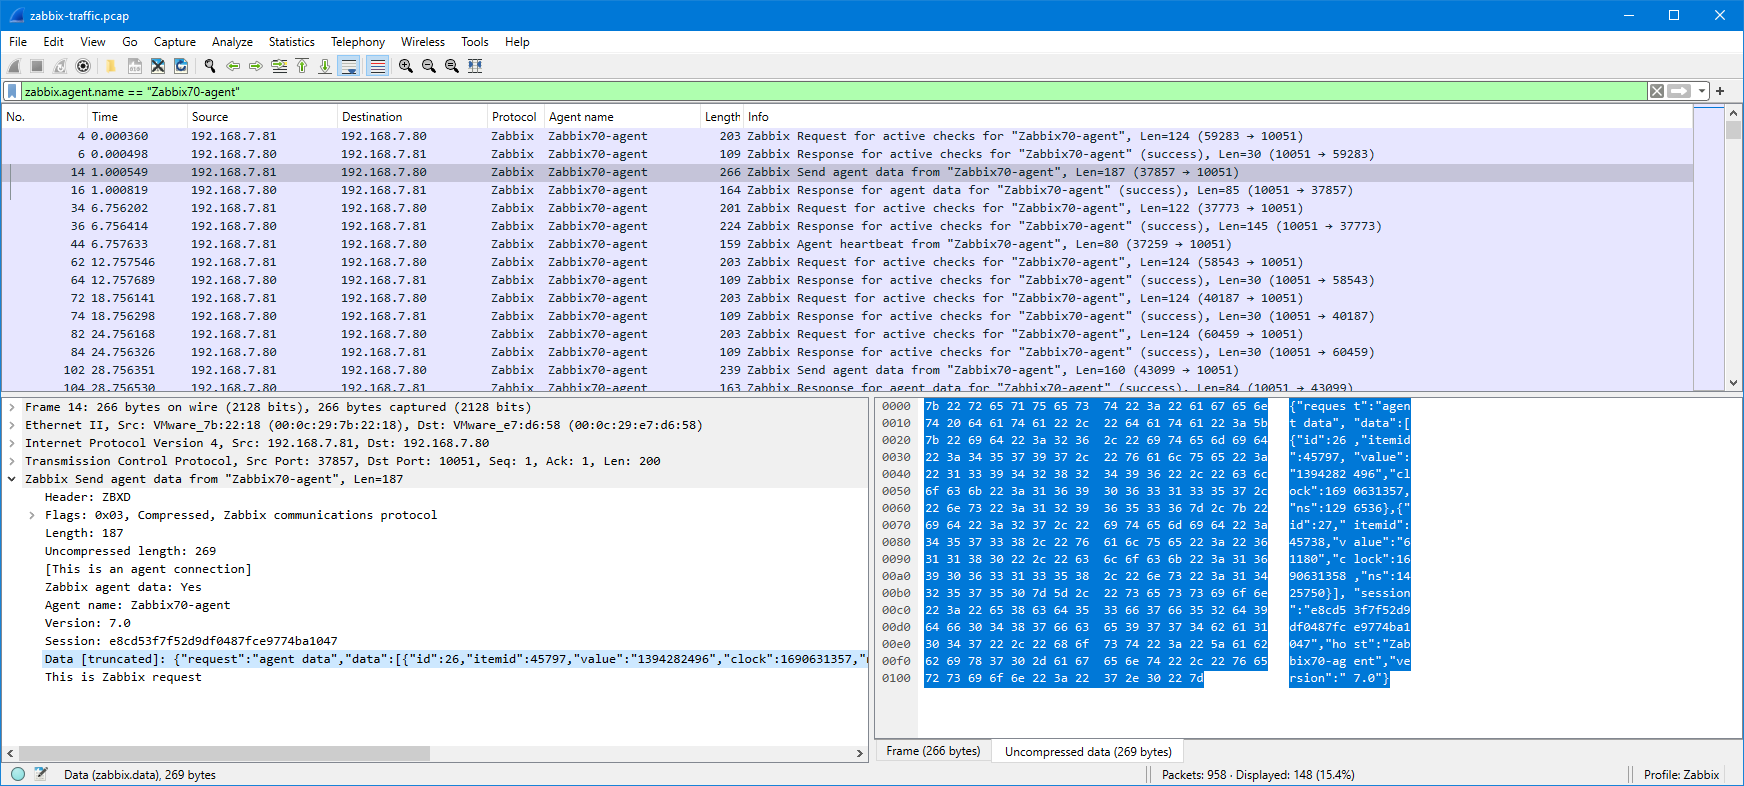
This is Zabbix agent 2 so the packet is compressed, but as you notice Wireshark automatically uncompressed and showed the contents for me.
The JSON data is a bit hard to read there in the packet bytes pane, but I can right-click the “Data [truncated]” field and select Show packet bytes to see it better:
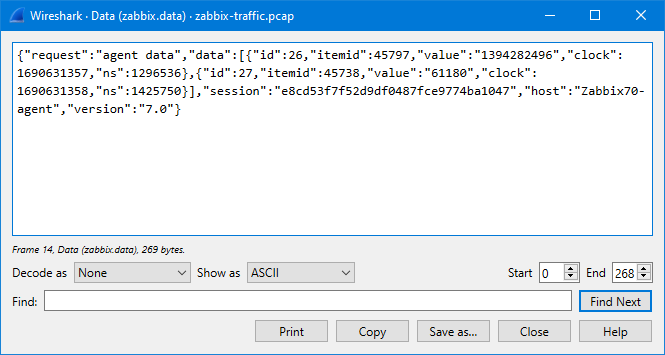
In the Show as dropdown list there is a selection for JSON to show it even better:
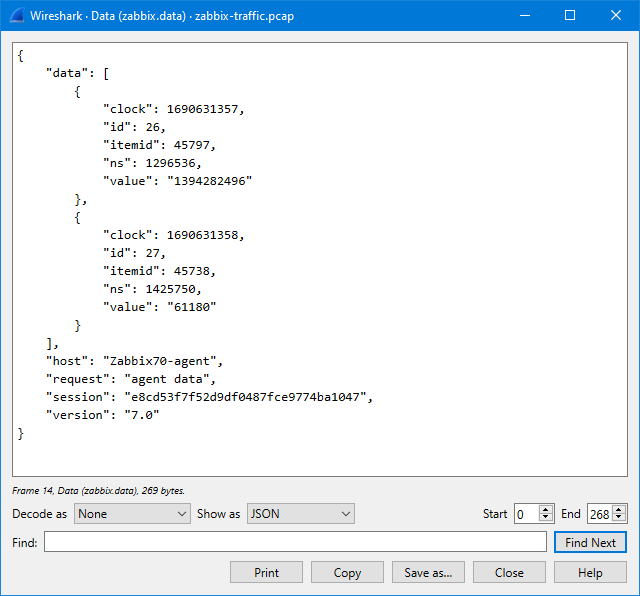
So, what does it show us? It shows that in this particular packet there are two data values sent, one for item ID 45797 and one for item ID 45738, with appropriate Unix-style timestamps (clock).
But how do we find out the item ID for the disk usage item?
You can find it in the Zabbix frontend GUI when editing the item: the item ID is shown in the browser address bar as itemid=45797.
But, since we have Wireshark at hand, we can also check the agent config packets that the server sent to the agent. First, add “and zabbix.agent.config and zabbix.response” in the display filter:
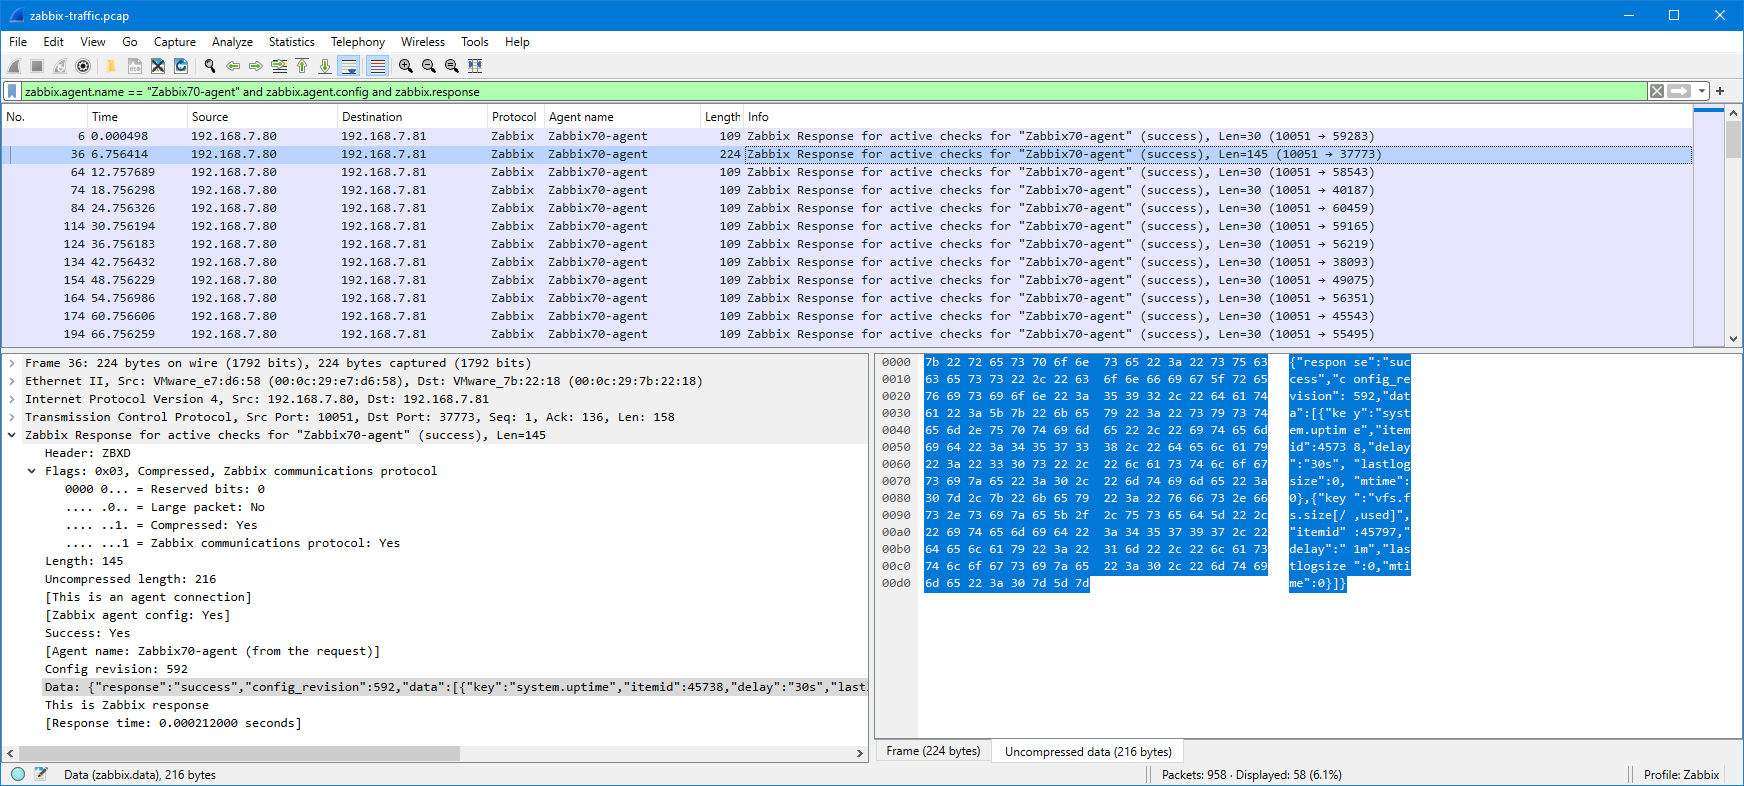
Most of the responses just contain {"response":"success"} to indicate that there were no changes in the configuration (this is the new incremental configuration update feature in Zabbix protocol since Zabbix version 6.4), but since we restarted the agent during the capture, we have a full agent configuration in one of the responses (the one packet that is larger than the others, packet #36). In that packet there is:
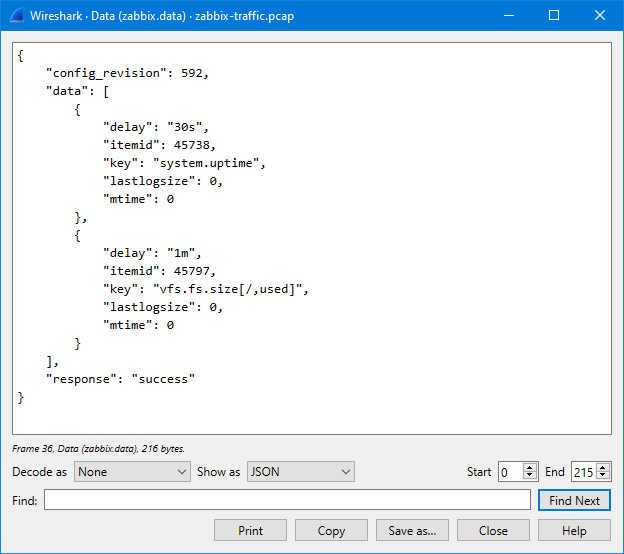
So there we see that the item ID corresponding to the vfs.fs.size[/,used] key is 45797.
(In this demo agent we only had two items configured, so the output was very short. In practical cases you certainly have many more items configured.)
Ok, after that small detour, let’s try to filter the agent data packets based on the item ID using display filter:
zabbix.agent.name == "Zabbix70-agent" and zabbix.agent.data and zabbix.data contains "45797"
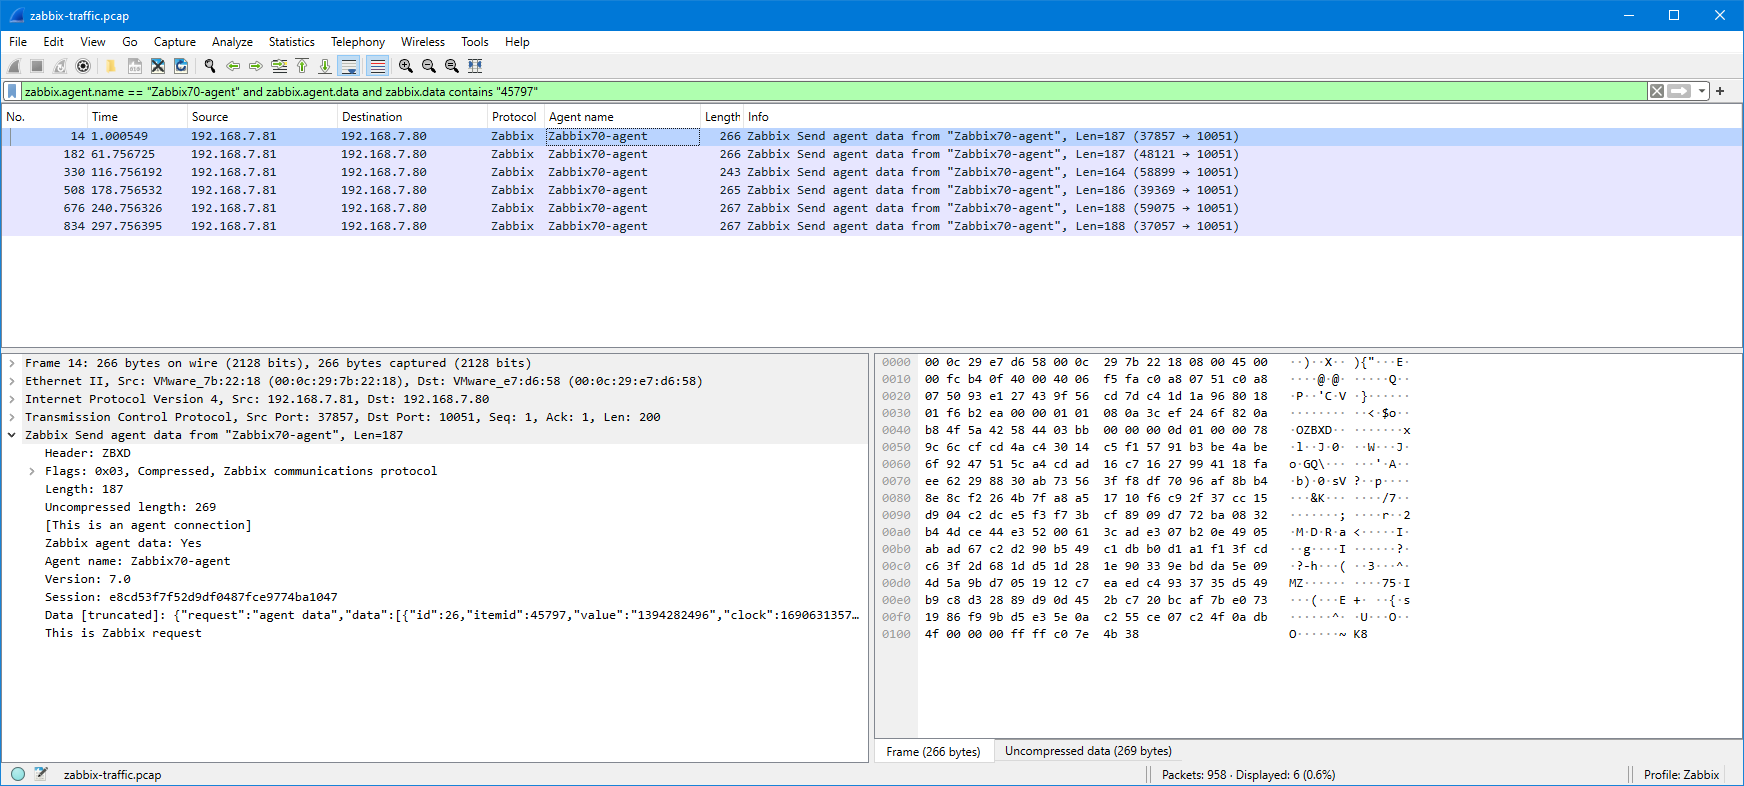
The “zabbix.data contains” filter is very simple in this example, you may get additional (false) matches in some more complicated cases, so be sure to check your results and adjust the filter as needed.
In this case we got six packets in the list (the capture length was about six minutes). When checking the data field contents more closely, we can see that the agent really sent the server the item values once every minute as configured. The values in the packets are (I copied the clock field from each packet separately and converted to local time using Epoch converter site):
| Packet number | “value” for itemid 45797 | “clock” for itemid 45797 | Absolute local time (from “clock”) |
|---|---|---|---|
| 14 | 1394282496 | 1690631357 | 14:49:17 |
| 182 | 1394290688 | 1690631417 | 14:50:17 |
| 330 | 1394290688 | 1690631477 | 14:51:17 |
| 508 | 1394290688 | 1690631537 | 14:52:17 |
| 676 | 1394290688 | 1690631597 | 14:53:17 |
| 834 | 1394290688 | 1690631657 | 14:54:17 |
But, when checking the same timespan in the item latest values in Zabbix frontend, there is only one value:
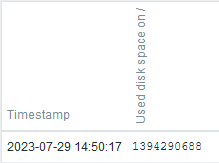
Thus, our collected evidence shows that the Zabbix agent did its configured job properly and it sent the disk usage information every minute to Zabbix server, but Zabbix server decided for some reason to discard some of the values.
In this example the saved value 1394290688 (at 14:50:17) is especially interesting, because the previous value was different (1394282496). The next collected values are the same, and they weren’t saved.
Let’s see the item configuration more carefully:
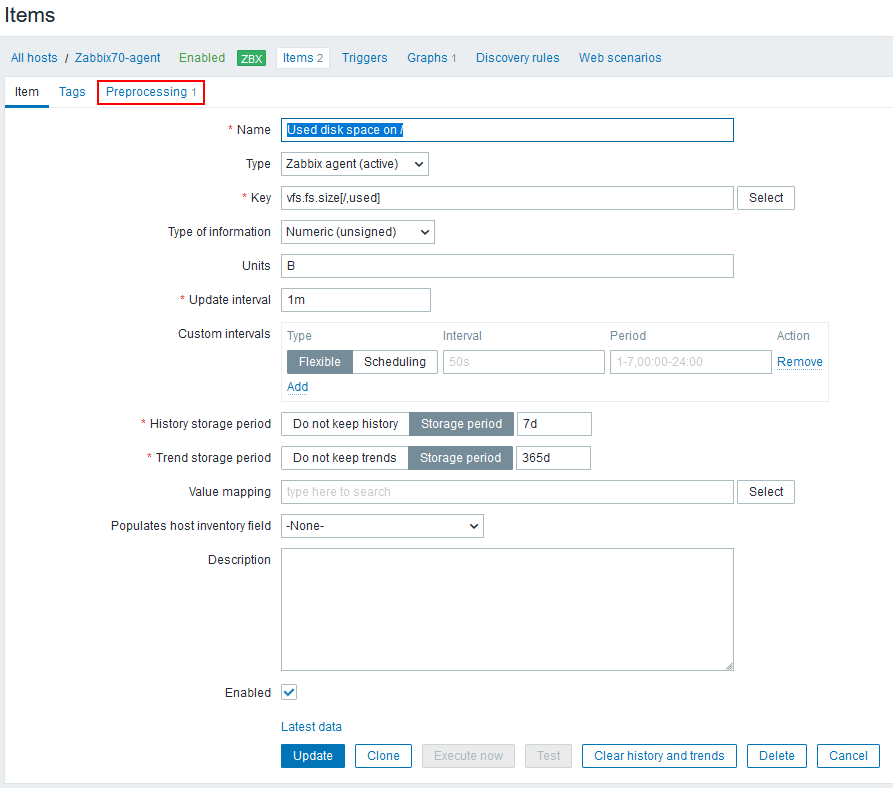
In the top of the screen there is a hint: “Preprosessing 1”, meaning that there is one preprocessing step configured for this item. Let’s open that tab:
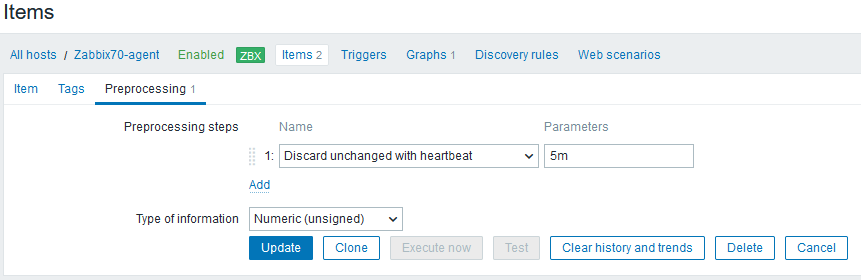
Aha! There is a preprocessing step that says: Discard unchanged with heartbeat: 5 minutes.
It means that whenever Zabbix server receives a value it compares it to the previously saved value, and if the value is the same as earlier, it doesn’t save it, unless the specified heartbeat time has elapsed since the last saved value.
This preprocessing rule is frequently used for items whose values aren’t changing that often, because this can dramatically reduce the database size while still enabling Zabbix to quickly react to changes.
So in this case there wasn’t any problem in the system. The configured behavior just didn’t match the user’s expectations.
Finally, some key takeaways when considering using Wireshark for Zabbix protocol troubleshooting in the application level:
- Ensure that you capture in the correct place to get the expected data in the capture. In this example I captured on the Zabbix server, but since I was only interested in a single agent, I could have also captured on that agent host, using whatever tool is appropriate for the operating system (like tcpdump, Wireshark, tshark, or see also my post about using Packet Monitor on Windows). Or, if there are capable network devices like firewalls in the path, maybe they can be used for capturing as well (check with your network team).
- Ensure that you capture with a suitable capture filter. In case of Zabbix protocol the interesting TCP (Transmission Control Protocol, the transport protocol on which Zabbix protocol runs) port is usually 10051, but if you are using Zabbix agents in passive mode (where server/proxy connects to the agents), then you need to also capture TCP port 10050. Also, in your Zabbix setup the ports may have been reconfigured to something else, so check the Zabbix configurations if unsure.
- When looking at the Zabbix protocol captures in Wireshark, experiment with the display filters to find out exactly what you are looking for. When you type “
zabbix.” (with the dot) in the display filter, Wireshark will automatically suggest you all possible Zabbix protocol fields that can be used in the filter. The field names are also shown in the status bar when you click on the fields. - Also, be aware of the fact that if your Zabbix components won’t talk to each other at all because of some misconfiguration or connectivity error, the Zabbix protocol display filter won’t show you anything in Wireshark. In those cases you need to resort to other ways of troubleshooting, maybe looking for any TCP-level issues in the captures.
- Practice! See what the Zabbix traffic (or any other network traffic) looks like when everything works. If you can, try to cause some errors in a testing environment (pull some cable out, disable the firewall rule, stop the server, etc.), and see how it then looks in your captures.
This post was originally published on the author’s blog.


Very useful information, looking forward on follow up article with details on analyzing TLS encrypted traffic.